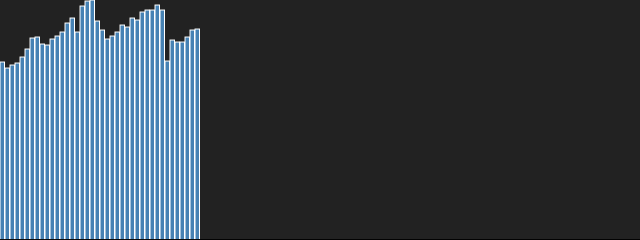
Code modified from tutorial, viewers count is pulled every 60 seconds via Justin.tv API, sample graph:
Note
This is no longer working since the shutdown of Justin.tv in August, 2014. (2015-07-19T02:09:00Z)
After I first tried D3.js for plotting GitHub following and watching graph, still didn’t know much about D3.js and I wanted to draw something really in real-time. It’s not easy to find a real-time data source in least one-minute interval, many public real-time data are released every day or month.
Anyway, I hacked a bit of the tutorial, so it looks more animated. I removed the pre-generated and let data fly in from right-side, also added transition on y and height. Rescaling after bar with maximal viewers moves out of graph.
0 comments:
Post a Comment
Note: Only a member of this blog may post a comment.