Storage Chart is a C code which visualizes the output of du(1) (disk space usage) in treemap graph. It is used normally with -s * option and argument, for example:
du -s * | sort -nr | ./schart
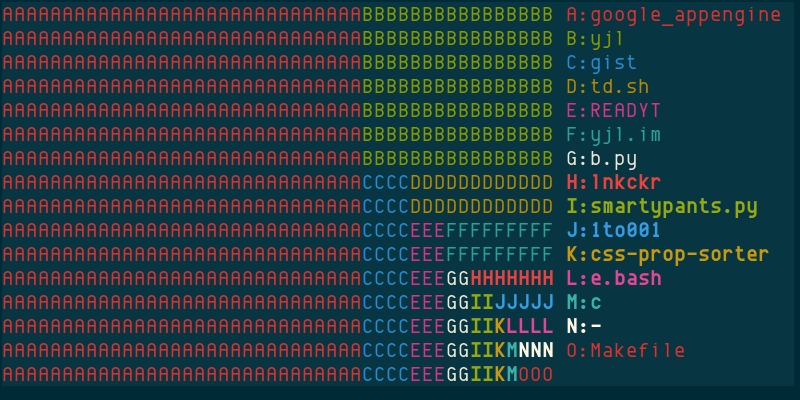
It is not an interactive program like Pysize, but the result is very simple and clear to read, and colorful. The program can be used for more general data, not just disk space usage, as long as the data format is number, tab character, then label. For example, some word counts of the source code of this program:
grep -oi '[a-z]\+' schart.c | sort | uniq -c | sort -nr |
while read c w; do printf "%d\t%s\n" $c $w; done | ./schart
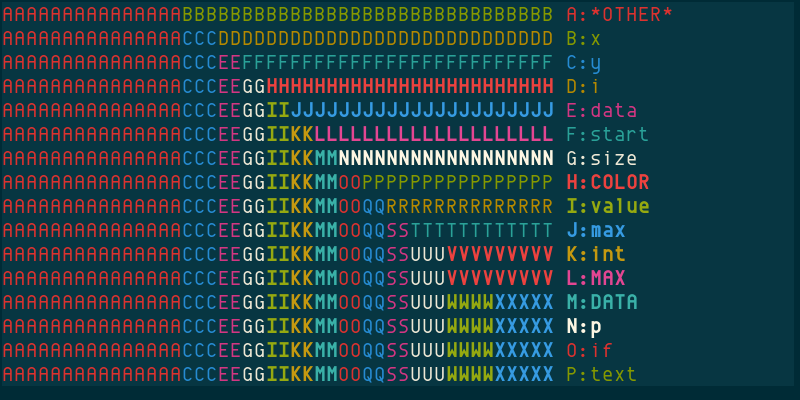
You can see it grouping small bits into “OTHER” entry, only shows 23 individual labels, after that, they all go into grouped label.
Storage Chart was written in C with ncurses by Kjetil Erga on 2015-01-03, license isn’t specified. You can compile it using:
# save the code as schart.c
% gcc -o schart -lncurses schart.c
0 comments:
Post a Comment
Note: Only a member of this blog may post a comment.